The problem
Navitrends, a digital solutions company, hosts websites that receive thousands of requests a day. Some come from vulnerability scans, mass login attempts or bots. Fixed rules (thresholds, signatures) miss new attacks and raise many false alarms.
Data: raw logs from May to July 2025, 92 files, 1.83 GB, with no labels at all. That called for an unsupervised method, then an honest way to validate it.
What the data shows
Exploratory analysis of the 10 most active addresses showed clear patterns: about 9,000 requests each, highly varied URLs (entropy close to 13) with a single declared browser (entropy 0), mostly 404 responses and repeated hits on admin or password pages. That is the signature of automated scanners. These findings guided the choice of features.
- ParsingRegular expressions: IP, time, method, URL, HTTP code, browser, size
- EnrichmentSensitive URLs (login, admin), country and operator (GeoLite2)
- AggregationPer IP address and per 5-minute window
- Features11 indicators: volumes, errors, entropies, sizes, changes
- Final dataset697,706 windows ready for the model
- Volume: GET and POST request counts, response sizes.
- Errors: 4xx and 5xx responses.
- Diversity: Shannon entropy of URLs and declared browsers.
- Security: number of sensitive URLs visited.
- Dynamics: change from the previous window.
The model
- Isolation Forest scores each window (100 trees, √N samples, fixed seed); the score is turned into an anomaly probability. I compared it with an autoencoder by cross-checking the addresses both flagged.
- DBSCAN then groups the anomalies into behaviour families, with a radius chosen from the k-nearest-neighbour distance curve (elbow near 0.565), so the analyst handles groups rather than one address at a time.
- Test on an unseen day: the logs of 12 August 2025, excluded from training.
| Family found (12 August) | Addresses | Interpretation |
|---|---|---|
| Many GETs, few POSTs | 8 | Site scraper or aggressive crawler |
| Many POSTs | 14 | Injection or spam attempts |
| Low volume, unusual behaviour | 17 | To investigate |
| Rotating browsers and sensitive URLs | 4 | Stealthy, targeted attack |
Cluster quality: silhouette of 0.65 and Davies-Bouldin index of 0.45 on the GET/POST combination; 0.56 and 0.52 on the browsers/sensitive URLs combination.
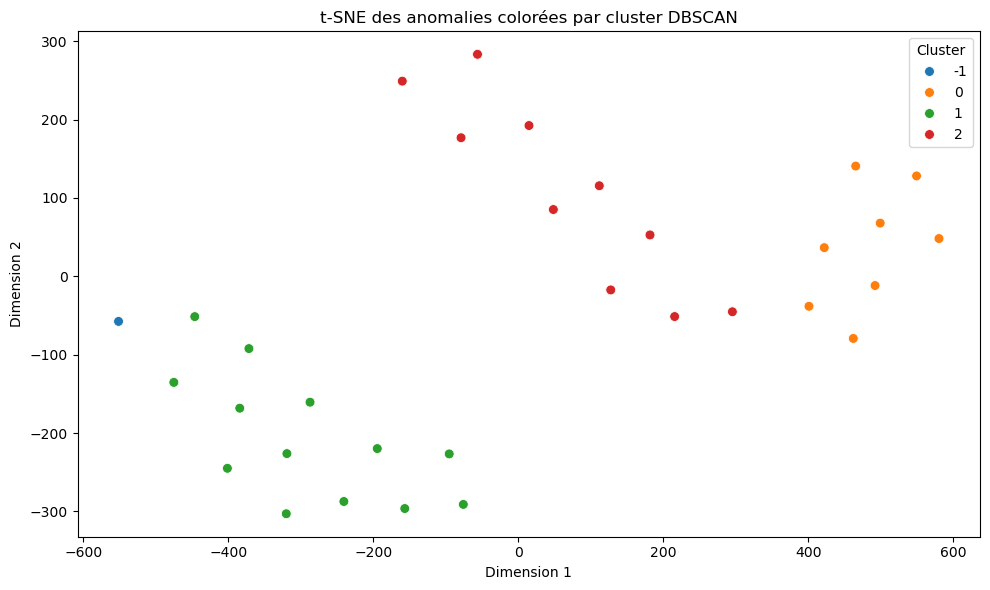
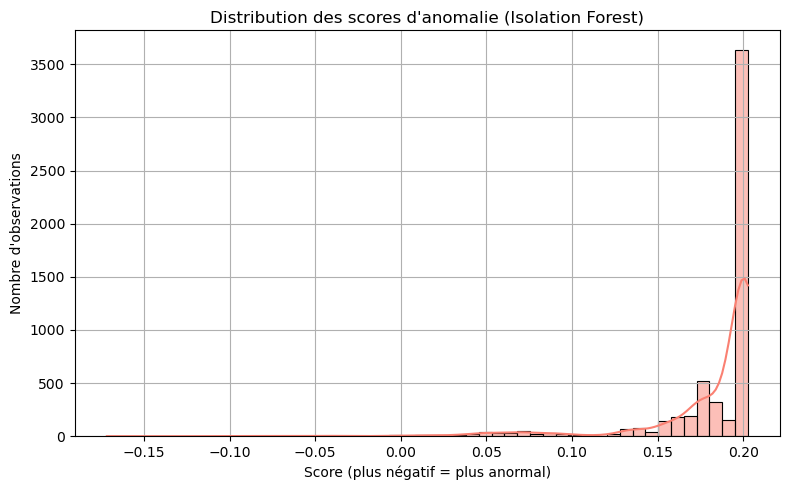
The application and the charts are in French, the language of the internship.
Validation without labels
With no ground truth, I validated in two complementary ways.
- External threat database. The detected addresses were checked against CrowdSec, a collaborative database of malicious addresses: a large share were already listed for brute-force attacks or aggressive scans.
- Simulated set. 2,000 windows including 120 injected anomalies, so standard metrics could be computed.
- Recall: anomalies found
- 100%
- Precision of the alerts
- 85%
- F1 score (anomalies)
- 0.92
- Overall accuracy
- 89.5%
Every injected anomaly is found, at the cost of some false alarms (15% of alerts). Injected anomalies are easier to spot than real attacks: these figures validate the method; they do not guarantee the same performance in production.
The ThreatLens application
A Flask web application for security analysts, connected to the model.
- Continuous analysis: a PHP logger records the site's requests; a background process analyses them in batches of 100 and updates the dashboard.
- For the analyst: anomaly list, a page per address (country, city, operator), a Leaflet map, an alert threshold set by the admin, a PDF report by email (ReportLab, matplotlib).
- Securing the tool: sign-up approved by an admin, roles, hashed passwords, reset by a code sent by email.
- Performance: SQLite for history, in-memory ring buffers protected by a lock, a geolocation cache: interface responses under 200 ms.
The application and the charts are in French, the language of the internship.
What I learned
The first addresses flagged were search engine crawlers: their behaviour is truly unusual, but not malicious. An anomaly is not an attack. This is why the tool shows the country and network operator of each address: the analyst can triage quickly, and the final decision stays with them.
Limits
False alarms. Legitimate bots show up as anomalies; an allow-list or a triage step is needed.
Indirect validation. The metrics come from injected anomalies, and the CrowdSec match was not quantified; an external database is not absolute proof.
Detection delay. 5-minute windows mean up to 5 minutes before an alert.
Deployment. The application was tested locally; production deployment on a server was the next step.
Confidentiality
This work was done for a company. The code and data remain confidential: this page presents the approach, the validated results and charts from my internship report, with no screenshots of the tools.